←Back to portfolio

POWER BI · FINANCIAL REPORTING

Financial Management System

A Power BI financial dashboard connecting financial indicators, accounting reports and transaction details in one place to support informed decisions.
Power BIDAXPower QueryFinancial AnalysisAccounting Reports
Financial Management System Home page with financial reporting and management analysis navigation

An illustrative business scenario

This project uses fictional data for demonstration purposes. It represents a company with multiple operating and administrative sectors. Sector 1 is the administrative sector, whose expenses are allocated to the other sectors at year-end in proportion to each recipient sector’s share of their total external revenue, excluding internal revenue.

The project brings analysis and accounting together by connecting financial KPIs with their supporting reports and details. It puts information and its context in one place, making it easier to search, verify figures and make decisions without navigating separate pages and reports in an ERP system.

This approach makes fuller use of Power BI through an integrated reporting experience, interactive filters and access to accounting detail.
Explore the interactive report

Select a sector and date range, navigate the report pages and explore the accounting details.

Open report in a new window
01

Home — Financial Analytics Portal

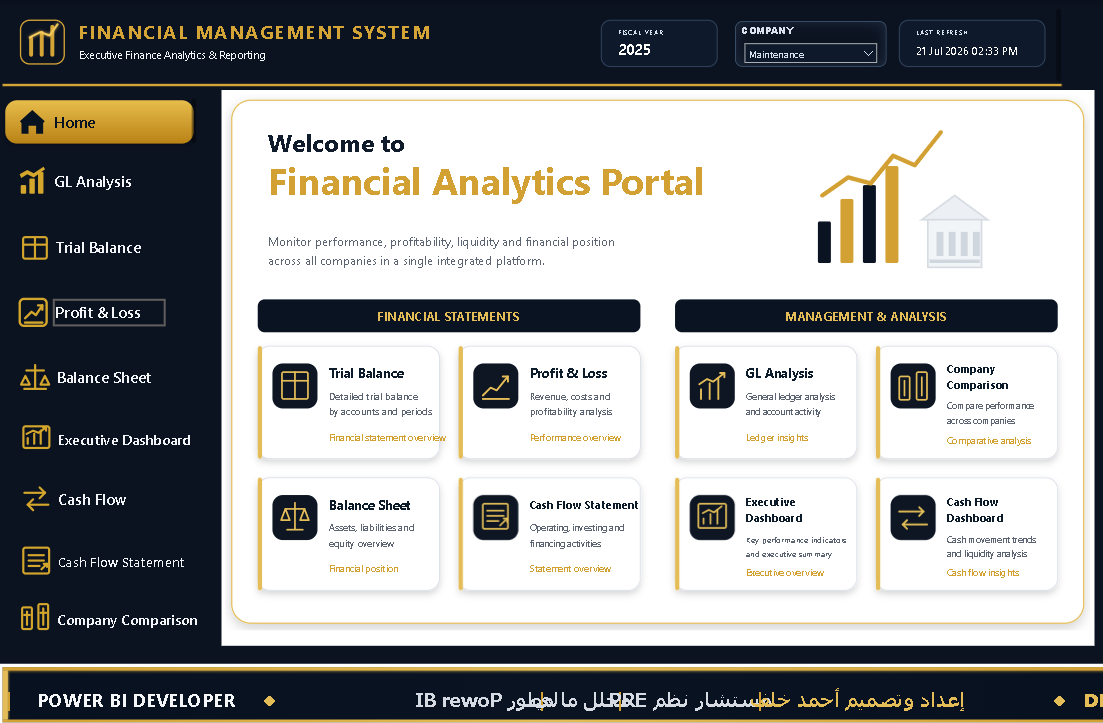
The starting point for the reporting experience. The Home page brings together navigation to GL Analysis, Trial Balance, Profit & Loss, Balance Sheet, cash flow, the Executive Dashboard and Company Comparison. Fiscal-year context and a sector selector keep the reporting scope visible.

Financial Management System Home page with financial reporting and management analysis navigation
View full-size dashboard ↗
02

General Ledger Analysis

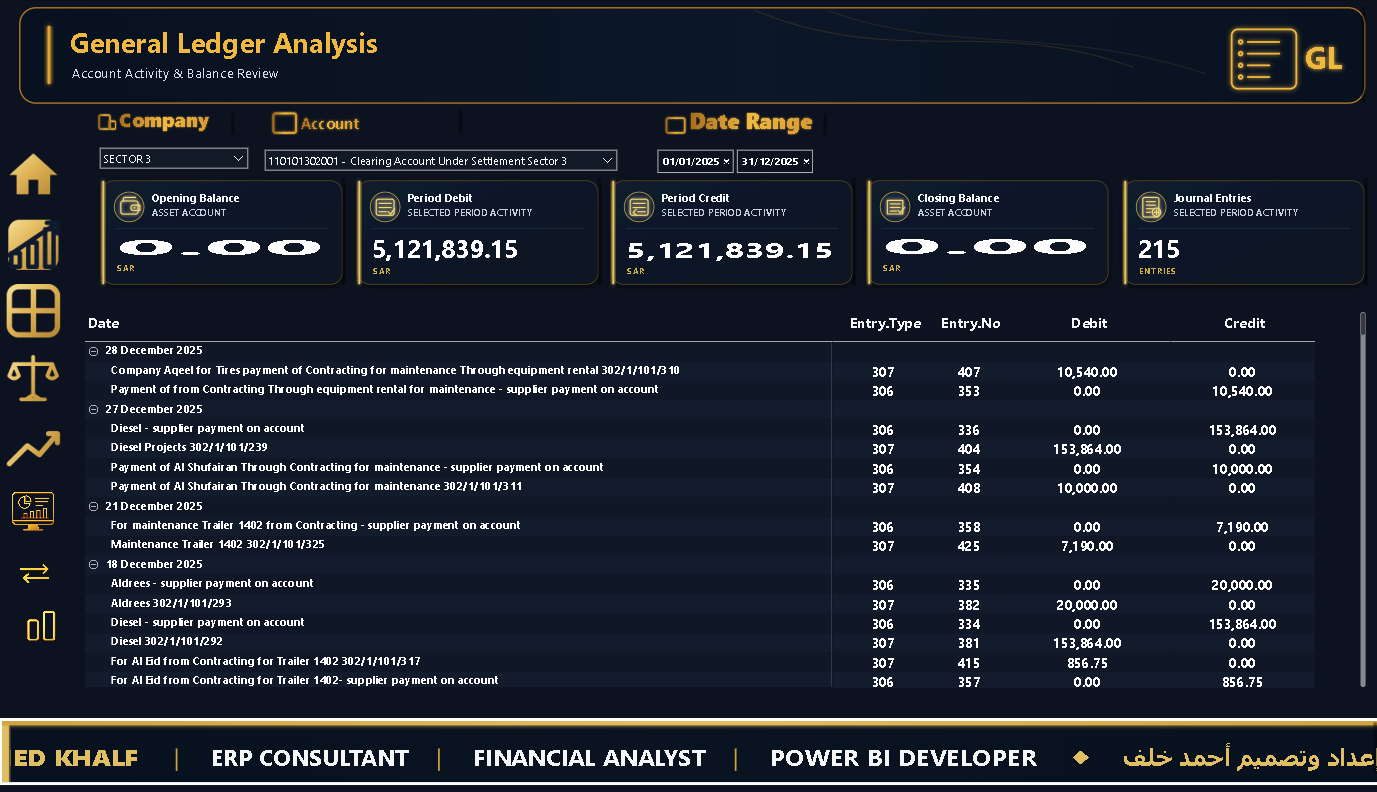
Review account activity by sector, account and date range. Opening balance, period debits and credits, closing balance and journal-entry count provide a summary, while the ledger below shows dated transactions with descriptions, entry types, entry numbers and debit/credit amounts. This connects the account balance to its supporting entries for review and reconciliation.

General Ledger Analysis showing account filters, opening and closing balances, period debits and credits, and journal-entry details
View full-size dashboard ↗
03

Trial Balance

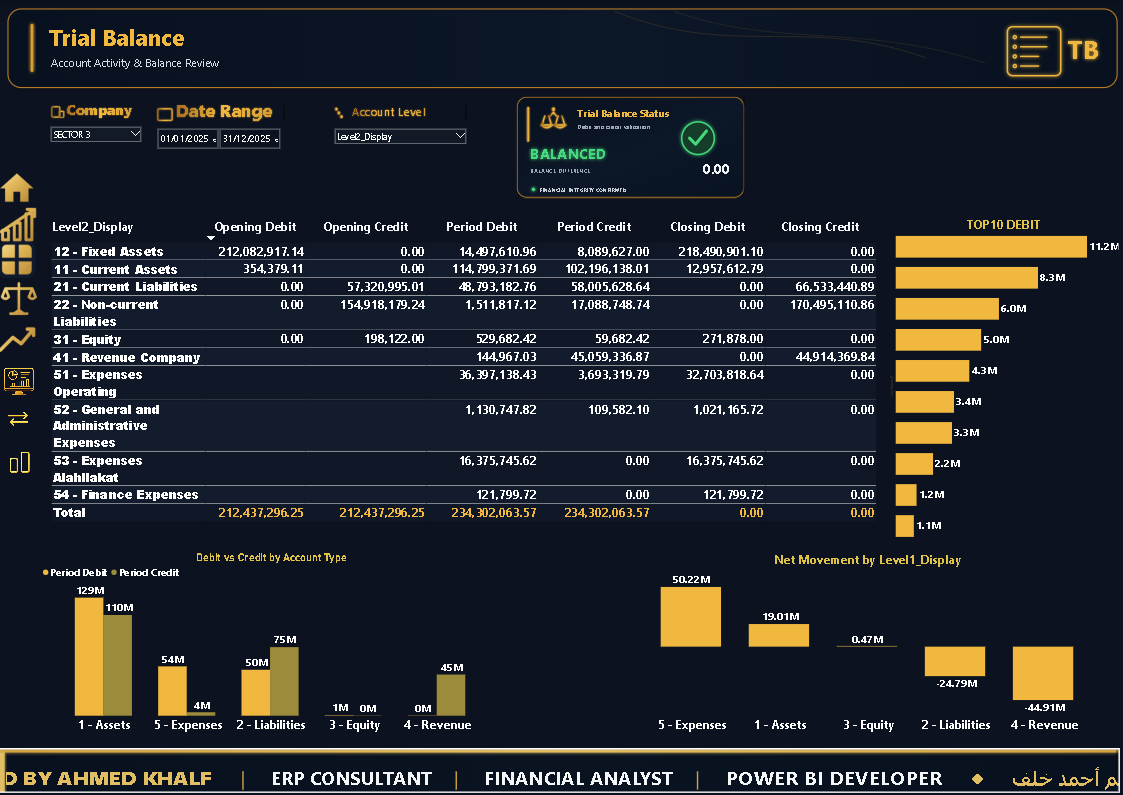
Review opening balances, period movements and closing balances in separate debit and credit columns, with filters for sector, date range and account level. A balance-status card highlights the debit–credit difference, while charts compare period debits and credits by account type, show net movement across major account groups and rank the top ten debit amounts. The page combines accounting review with a visual overview of account activity.

Trial Balance with account-level selection, opening and closing debit and credit balances, period movements, balance-status indicator and account activity charts
View full-size dashboard ↗
04

Profit & Loss Statement

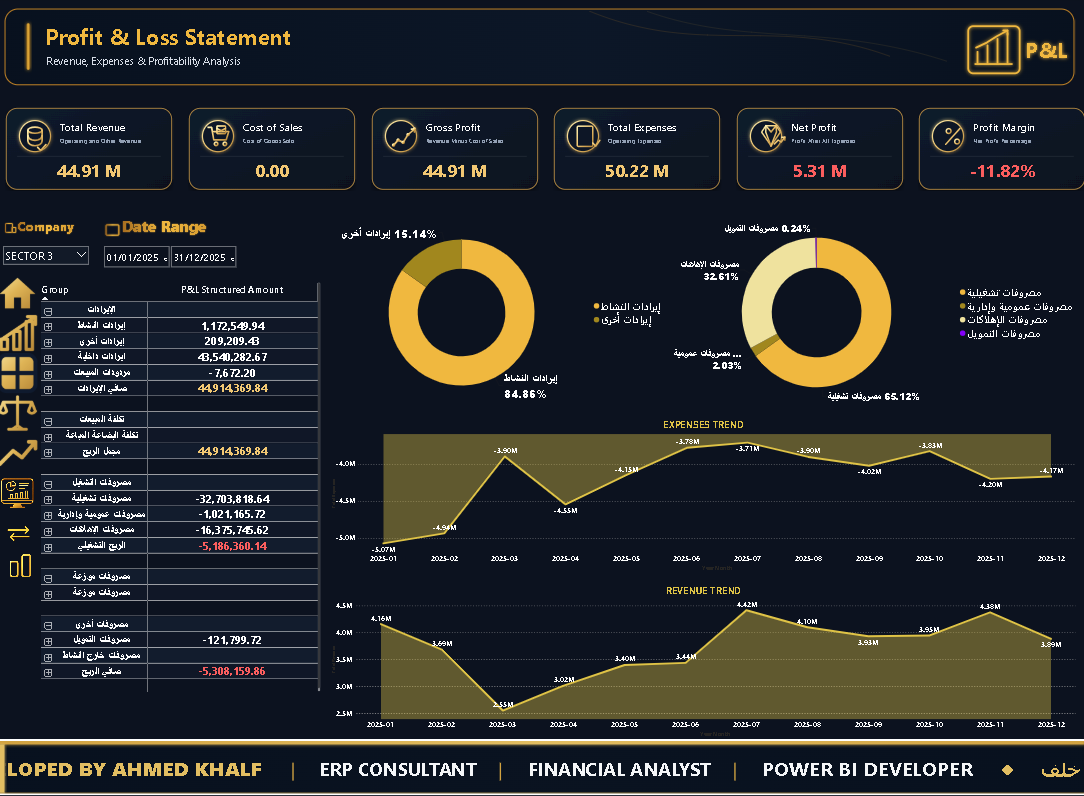
Follow revenue, cost of sales, gross profit, total expenses, net profit or loss and profit margin for the selected sector and period. The detailed statement connects these indicators to revenue and expense categories, including allocated expenses. Revenue and expense breakdowns show their composition, while monthly trends help explain changes in performance across the year.

Profit and Loss dashboard with profitability indicators, a detailed income statement, revenue and expense breakdowns and monthly trends
View full-size dashboard ↗
05

Balance Sheet

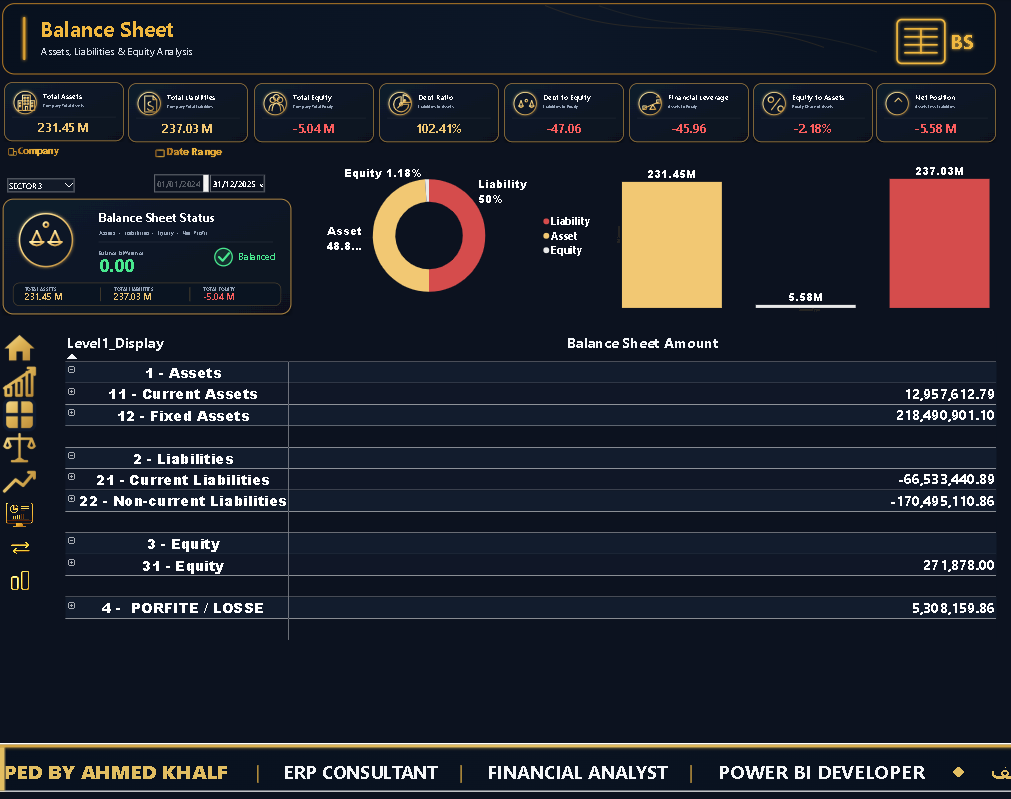
Review assets, liabilities and equity for the selected sector and date range, alongside debt ratio, debt-to-equity, financial leverage, equity-to-assets and net position indicators. A balance-status card supports reconciliation, while composition and comparison charts summarize the financial structure. The expandable statement presents current and fixed assets, current and non-current liabilities, equity and the profit or loss line, connecting headline indicators to accounting detail.

Balance Sheet dashboard with assets, liabilities and equity indicators, financial ratios, a balance-status card, comparison charts and an expandable statement
View full-size dashboard ↗
06

Cash Flow Dashboard

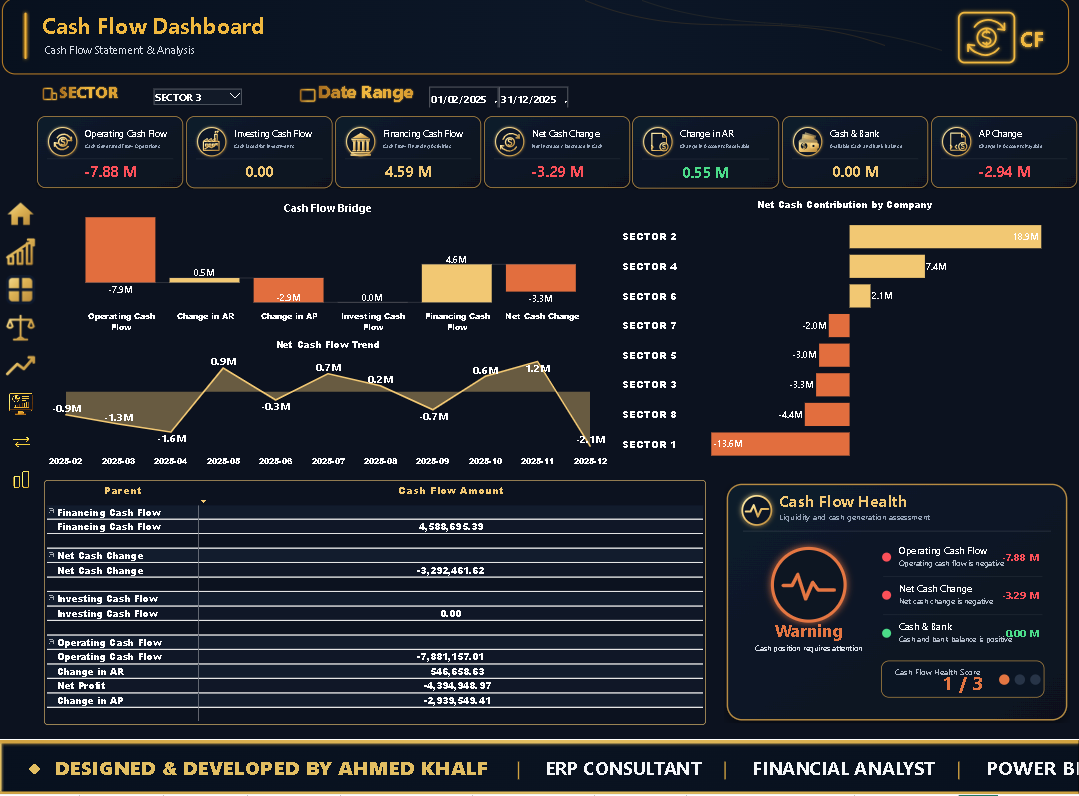
Monitor operating, investing and financing cash flows alongside net cash change, receivable and payable movements, and cash and bank balances. A cash flow bridge, monthly trend and sector contribution chart provide complementary views of cash movement. The detailed statement connects the summary to its components, while the Cash Flow Health panel highlights the displayed liquidity signals for the selected sector and period.

Cash Flow Dashboard showing operating, investing and financing flows, cash movement charts, sector contributions, detailed statement and a Cash Flow Health panel
View full-size dashboard ↗
07

Executive Dashboard

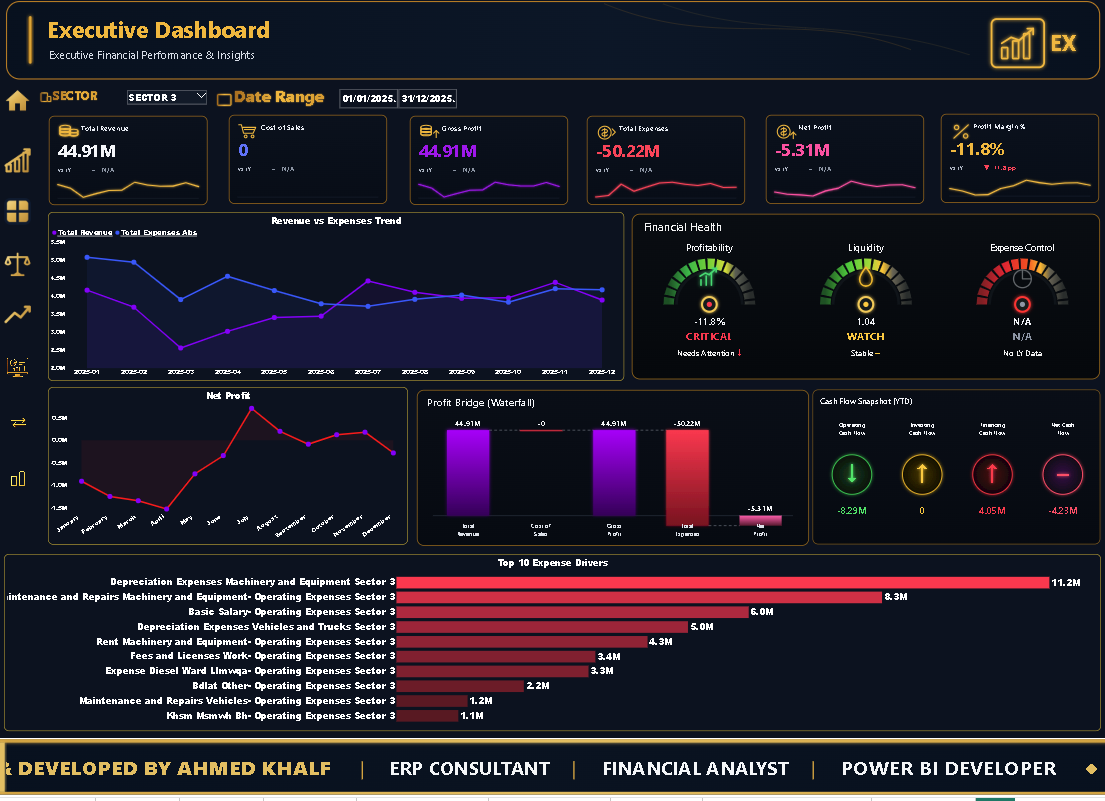
A management overview combining revenue, cost of sales, gross profit, expenses, net profit and margin with compact trend lines. Revenue versus expenses, monthly net profit, a profit bridge and the top ten expense drivers help explain performance. Financial-health gauges and a year-to-date cash flow snapshot bring profitability and liquidity into the same view. A deliberately broader color palette distinguishes the charts and draws attention to individual measures while retaining the suite’s dark background and gold framing.

Executive Dashboard with financial KPIs, revenue and expense trends, financial-health gauges, profit bridge, cash flow snapshot and top ten expense drivers
View full-size dashboard ↗
08

Sector Comparison

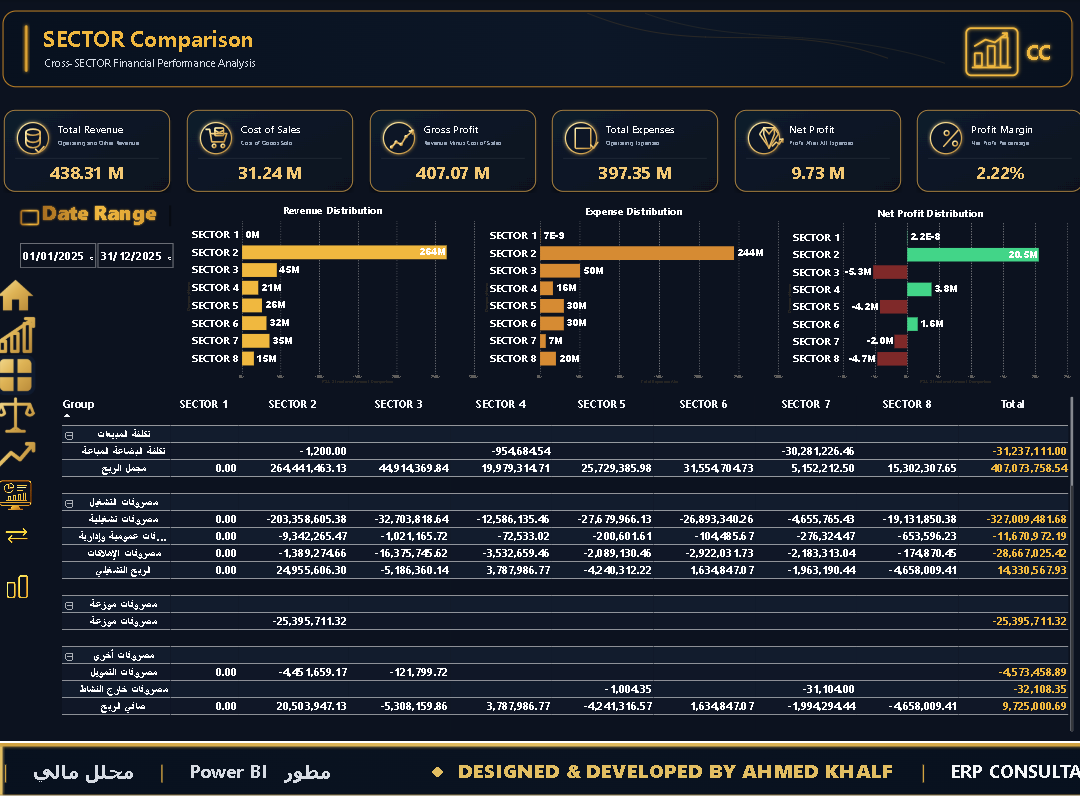
Compare revenue, expenses and net profit across eight sectors for the selected period, supported by overall profitability indicators and a detailed side-by-side income statement. Positive and negative results use distinct colors to make differences easier to identify and connect each sector’s performance to its underlying accounting categories.

Year-end allocation: in this illustrative management-reporting model, Sector 1 is the administrative sector. Its transactions are fully allocated to the other sectors at year-end using their relative shares of external revenue, excluding internal revenue, leaving its reported result at zero to the displayed accounting precision. This reflects the allocation process, rather than an absence of activity during the year.

Sector Comparison dashboard with revenue, expense and net profit distributions and a detailed income statement across eight sectors
View full-size dashboard ↗